Previous
Default interface
If your machine is not working as expected, there are several steps you can take for debugging.
Start by checking the machine logs.
If that doesn’t help, you can enable debug logs or ssh into the machine.
For common errors see Common Errors.
If your machine shows as offline on Viam, restart viam-server by running the command to start viam-server and adding the -debug option.
To do this, you will need to know if you installed viam-server with viam-agent (most common) or manually.
You can check this by seeing if viam-agent is running.
Run the following command:
ps aux | grep viam-agent
root      566431  0.5  0.2 1247148 20336 ?       Ssl  11:24   0:00 /opt/viam/bin/viam-agent --config /etc/viam.json
If you see a process running viam-agent, then you used viam-agent to install viam-server.
If not follow the steps for the standalone version.
On Linux, you can query your logs with journalctl:
sudo journalctl --unit=viam-agent
Alternatively you can restart viam-server manually and write logs to a log file:
First check where the viam-server binary is and where the machine cloud credentials file for your machine is:
ps aux | grep viam-server
root      566219 83.6  1.1 1966984 88896 ?       Sl   11:17   0:02 /opt/viam/bin/viam-server -config /etc/viam.json
Stop viam-agent:
sudo systemctl stop viam-agent
Then run viam-server with the -debug option and pass in your machine cloud credentials file:
/opt/viam/bin/viam-server -debug -config /etc/viam.json -log-file logs.txt
Then check the logs file
On Linux, you can query your logs with journalctl:
sudo journalctl --unit=viam-server
Alternatively you can restart viam-server and write logs to a log file by stopping the running viam-server instance, and restarting it with the -logfile option:
First check where the viam-server binary is and where the machine cloud credentials file for your machine is:
ps aux | grep viam-server
root       865  1.6  0.2  11612  2428 ?        Ssl  11:42   0:56 /usr/local/bin/viam-server -config /etc/viam.json
Stop the system service running viam-server:
sudo systemctl stop viam-server
Then run viam-server with the -debug and -log-file options and pass in your machine cloud credentials file:
sudo /usr/local/bin/viam-server -debug -config /etc/viam.json -log-file logs.txt
Then check the logs file
By default, viam-server writes logs to STDOUT and does not store them in a file on your machine.
If you want to store your logs in a file, stop the running viam-server instance, and restart it with the -logfile option.
First check where the viam-server binary is and where the machine cloud credentials file for your machine is:
ps aux | grep viam-server
naomi             8738   1.1  0.3 412233296  50720 s000  S+    5:24pm   0:00.40 viam-server -config /Users/naomi/Downloads/viam-mac-main.json
Kill the running viam-server instance.
Then run viam-server with the -debug and -log-file options and pass in your machine cloud credentials file:
viam-server -config ~/Downloads/viam.json -debug -log-file logs.txt
Then check the logs file
Be aware that while your machine is not able to connect to Viam, any changes to the machine’s configuration that you make in the web UI will not reach your machine.
Go to your machine’s CONFIGURE page and check whether any configured components have a red exclamation symbol on their configuration card. If so click on the symbol or expand the ERROR LOGS panel. The expanded panel shows you errors produced by that resource.
If your machine shows as online, go to the LOGS tab and check for errors or other information relevant to the issue.
You can filter your logs by keyword, log levels and time. You can use a regular expression as your keyword.
The default log level for viam-server and any running resources is Info.
If you are not seeing helpful logs, you can try changing the log level to Debug.
You can enable debug logs for all resources on a machine by adding "debug": true to the machine’s JSON configuration:
{
  "debug": true,
  "components": [{ ... }]
}
If this produces too many logs, you can instead enable debug logs for individual resources using the … menu on each resource.
You can also set the log level by configuring the log attribute in the machine configuration to match on patterns that capture the resources you are interested in.
For example:
"components": [ ... ]
"log": [
    {
    "pattern": "rdk.components.arm",
    "level": "debug",
    }, {
    "pattern": "rdk.services.*",
    "level": "debug",
    }, {
    "pattern": "<module-name>",
    "level": "debug",
    }
]
For more information on setting log levels see, Logging.
You may also find that not all logs you are expecting are displayed.
By default, viam-server deduplicates log messages that are deemed noisy.
To disable this behavior, see Disable log deduplication.
To access logs from the commandline, use viam machines logs on the command line or the Machines API.
If you have a Go module that doesn’t shut down properly or hangs during operation, you can get more information by sending a SIGQUIT signal to the process.
Run the following command, replacing <PID> with your module’s process identifier:
kill -3 <PID>
The process will dump a stack trace, visible in the viam-server logs, that shows:
Some issues are due to overall system health. To rule out machine health as the root cause of your issues, add a machine telemetry sensor and capture machine telemetry data with the data management service.
viam-server debug endpointsYou can use pprof to:
To enable the pprof endpoints, set enable_web_profile to true in your machine configuration:
{
  "components": [...],
  "services": [...],
  "enable_web_profile": true
}
For more information on advanced debugging endpoints, see Advanced debug endpoints.
To remotely access your machine from your terminal:
Add the ViamShellDanger fragment to your machine.
Once you have added the fragment, you can use the Viam CLI to open a shell on the machine.
viam machines part shell --organization=<org name> --location=<location name> --machine=<machine id>
You can access the local log file on your machine if needed.
If you need to copy files from your machine, use the viam machine part cp command.
Navigate to your machine’s page.
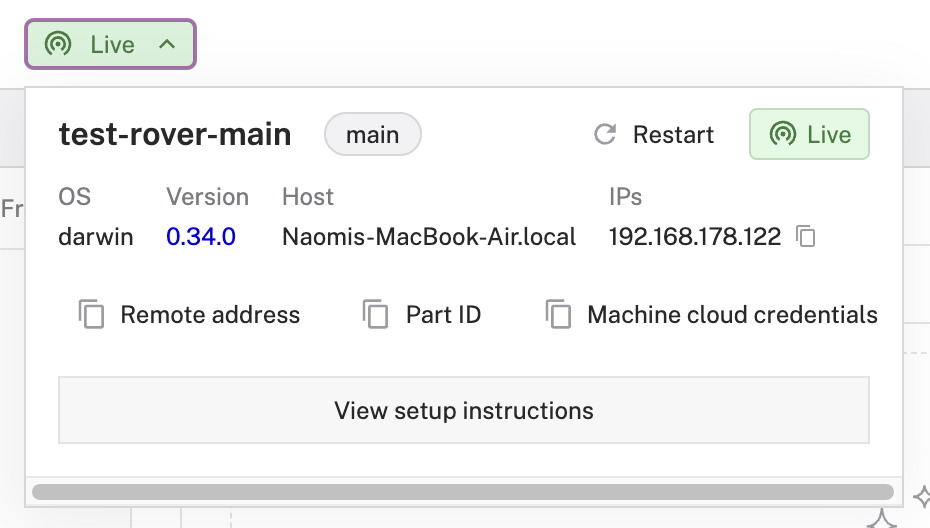
Select the part status dropdown to the right of your machine’s name on the top of the page.

If you installed viam-server with viam-agent you will see a Restart button. Click it.
Both viam-server and viam-agent will restart.
If you do not see the Restart button, click the … menu on the right side of the machine part’s card, and select Restart part. If restarting the machine part does not resolve the issue, ssh into the machine and stop and restart viam-server manually.
It takes a few minutes for viam-server to shut down and restart.
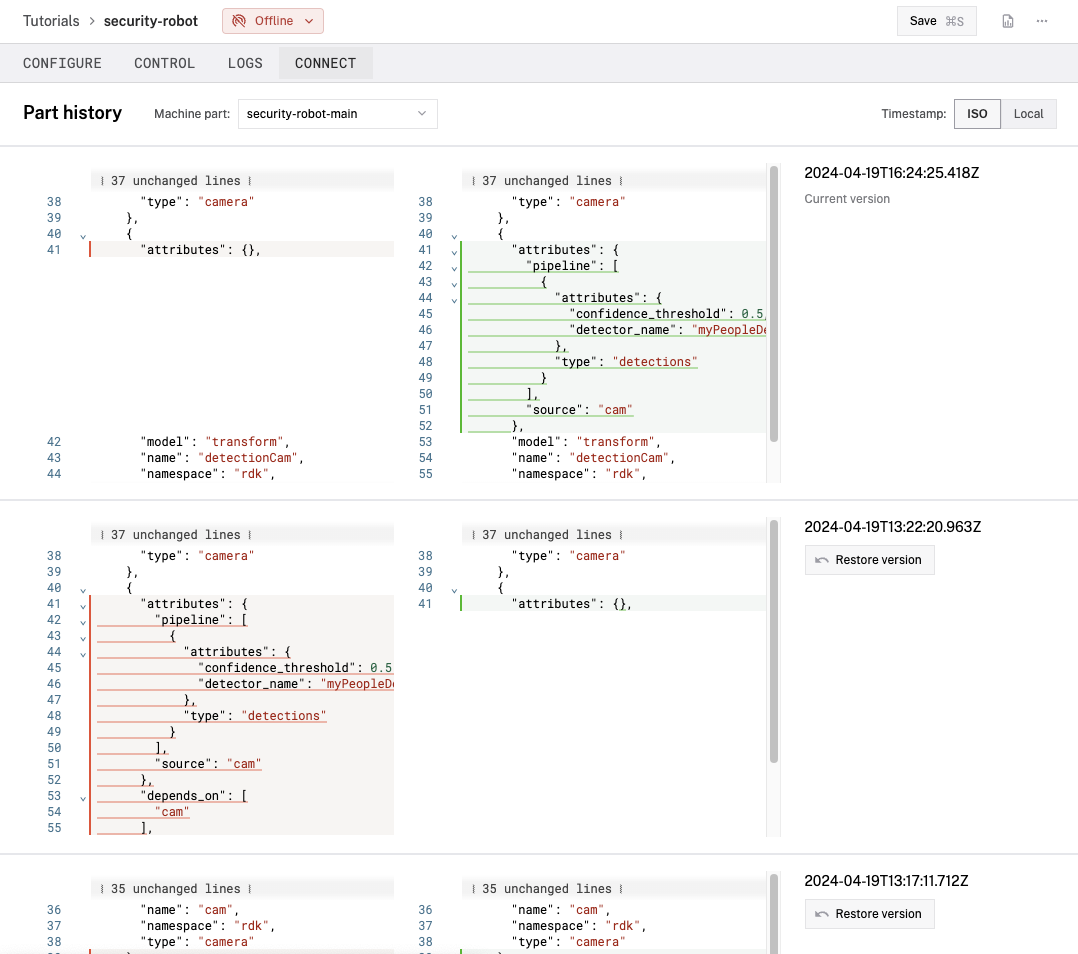
Viam keeps a record of your configuration changes, allowing you to revert to earlier configurations if needed. To see the history of the configuration of a machine part, click on History on the CONFIGURE tab.

To restore to an earlier version of your configuration, click the Restore version button next to the desired configuration.
If you have additional questions on debugging your machine, reach out to us on our Community Discord. Please post the error message you received along with the steps you took that caused the issue and we’ll see if we can help.
If you request support, you may be asked to share your location with the Viam Support team. To do so, navigate to the location you need support with and click, Add Viam support.
Once you have received support, you can remove Viam Support from your location by clicking Remove Viam support.
Was this page helpful?
Glad to hear it! If you have any other feedback please let us know:
We're sorry about that. To help us improve, please tell us what we can do better:
Thank you!