Previous
Part 1: Vision Pipeline
Goal: Configure and use a machine to cloud data capture pipeline.
Skills: Data capture configuration, cloud sync, browsing captured data.
Time: ~5 min
For inspection applications such as this one, monitoring defect detection is important both to ensure production line health and product quality. You want to ensure the vision model is detecting a very high percentage of defects and quickly detect any problems. In addition, it’s important to collect production training data to improve defect detection models over time.
In this part of the tutorial, you’ll configure continuous data capture to support these goals. To do this, you’ll use Viam’s built-in data capture and cloud sync. Once enabled, data capture services run automatically in the background. Data gets buffered locally, synced to the cloud at an interval you configure, and is then available for review in the Viam app.
Include the data service in your machine configuration:
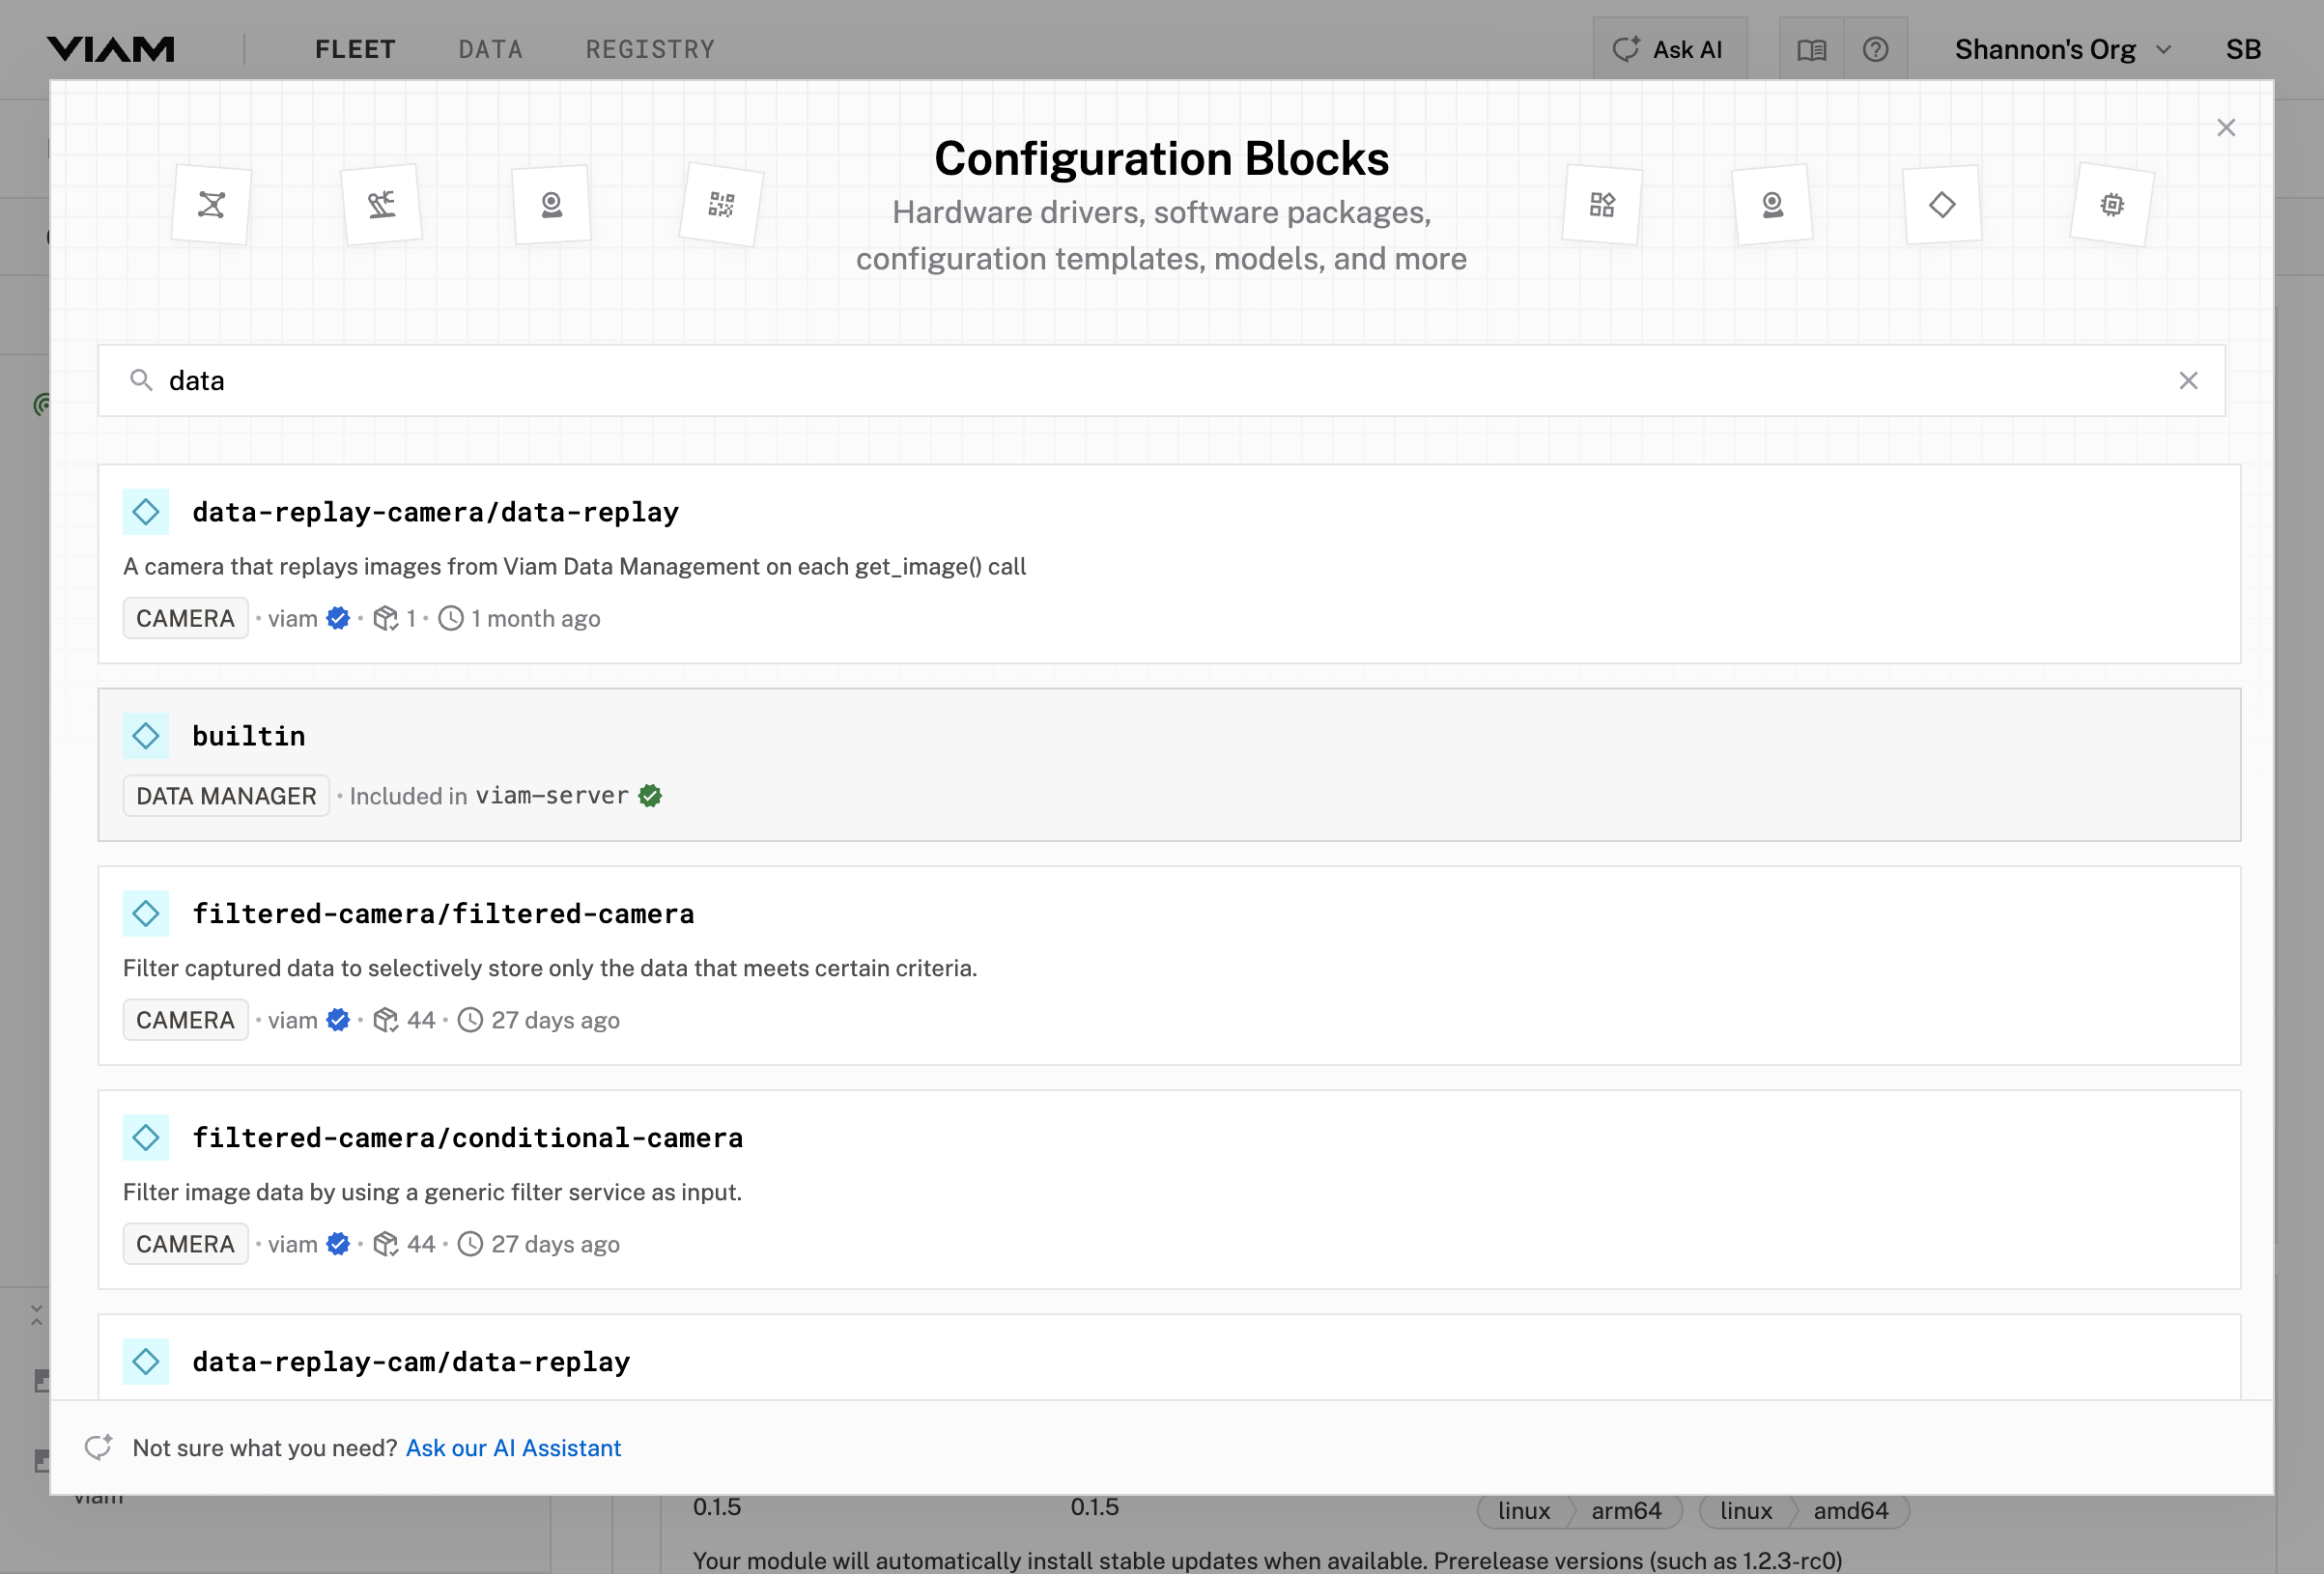
Click + next to inspection-station-1-main in the Configure tab
Click Configuration block
Search for data
Select builtin (this is the built-in Data Manager service)

Click Add component
Name it data-service
Click Add component
Save your updated machine configuration
The default configuration options for the data service are correct for our application so we can move on to capturing data from the vision service.
Enable data capture on the vision service:
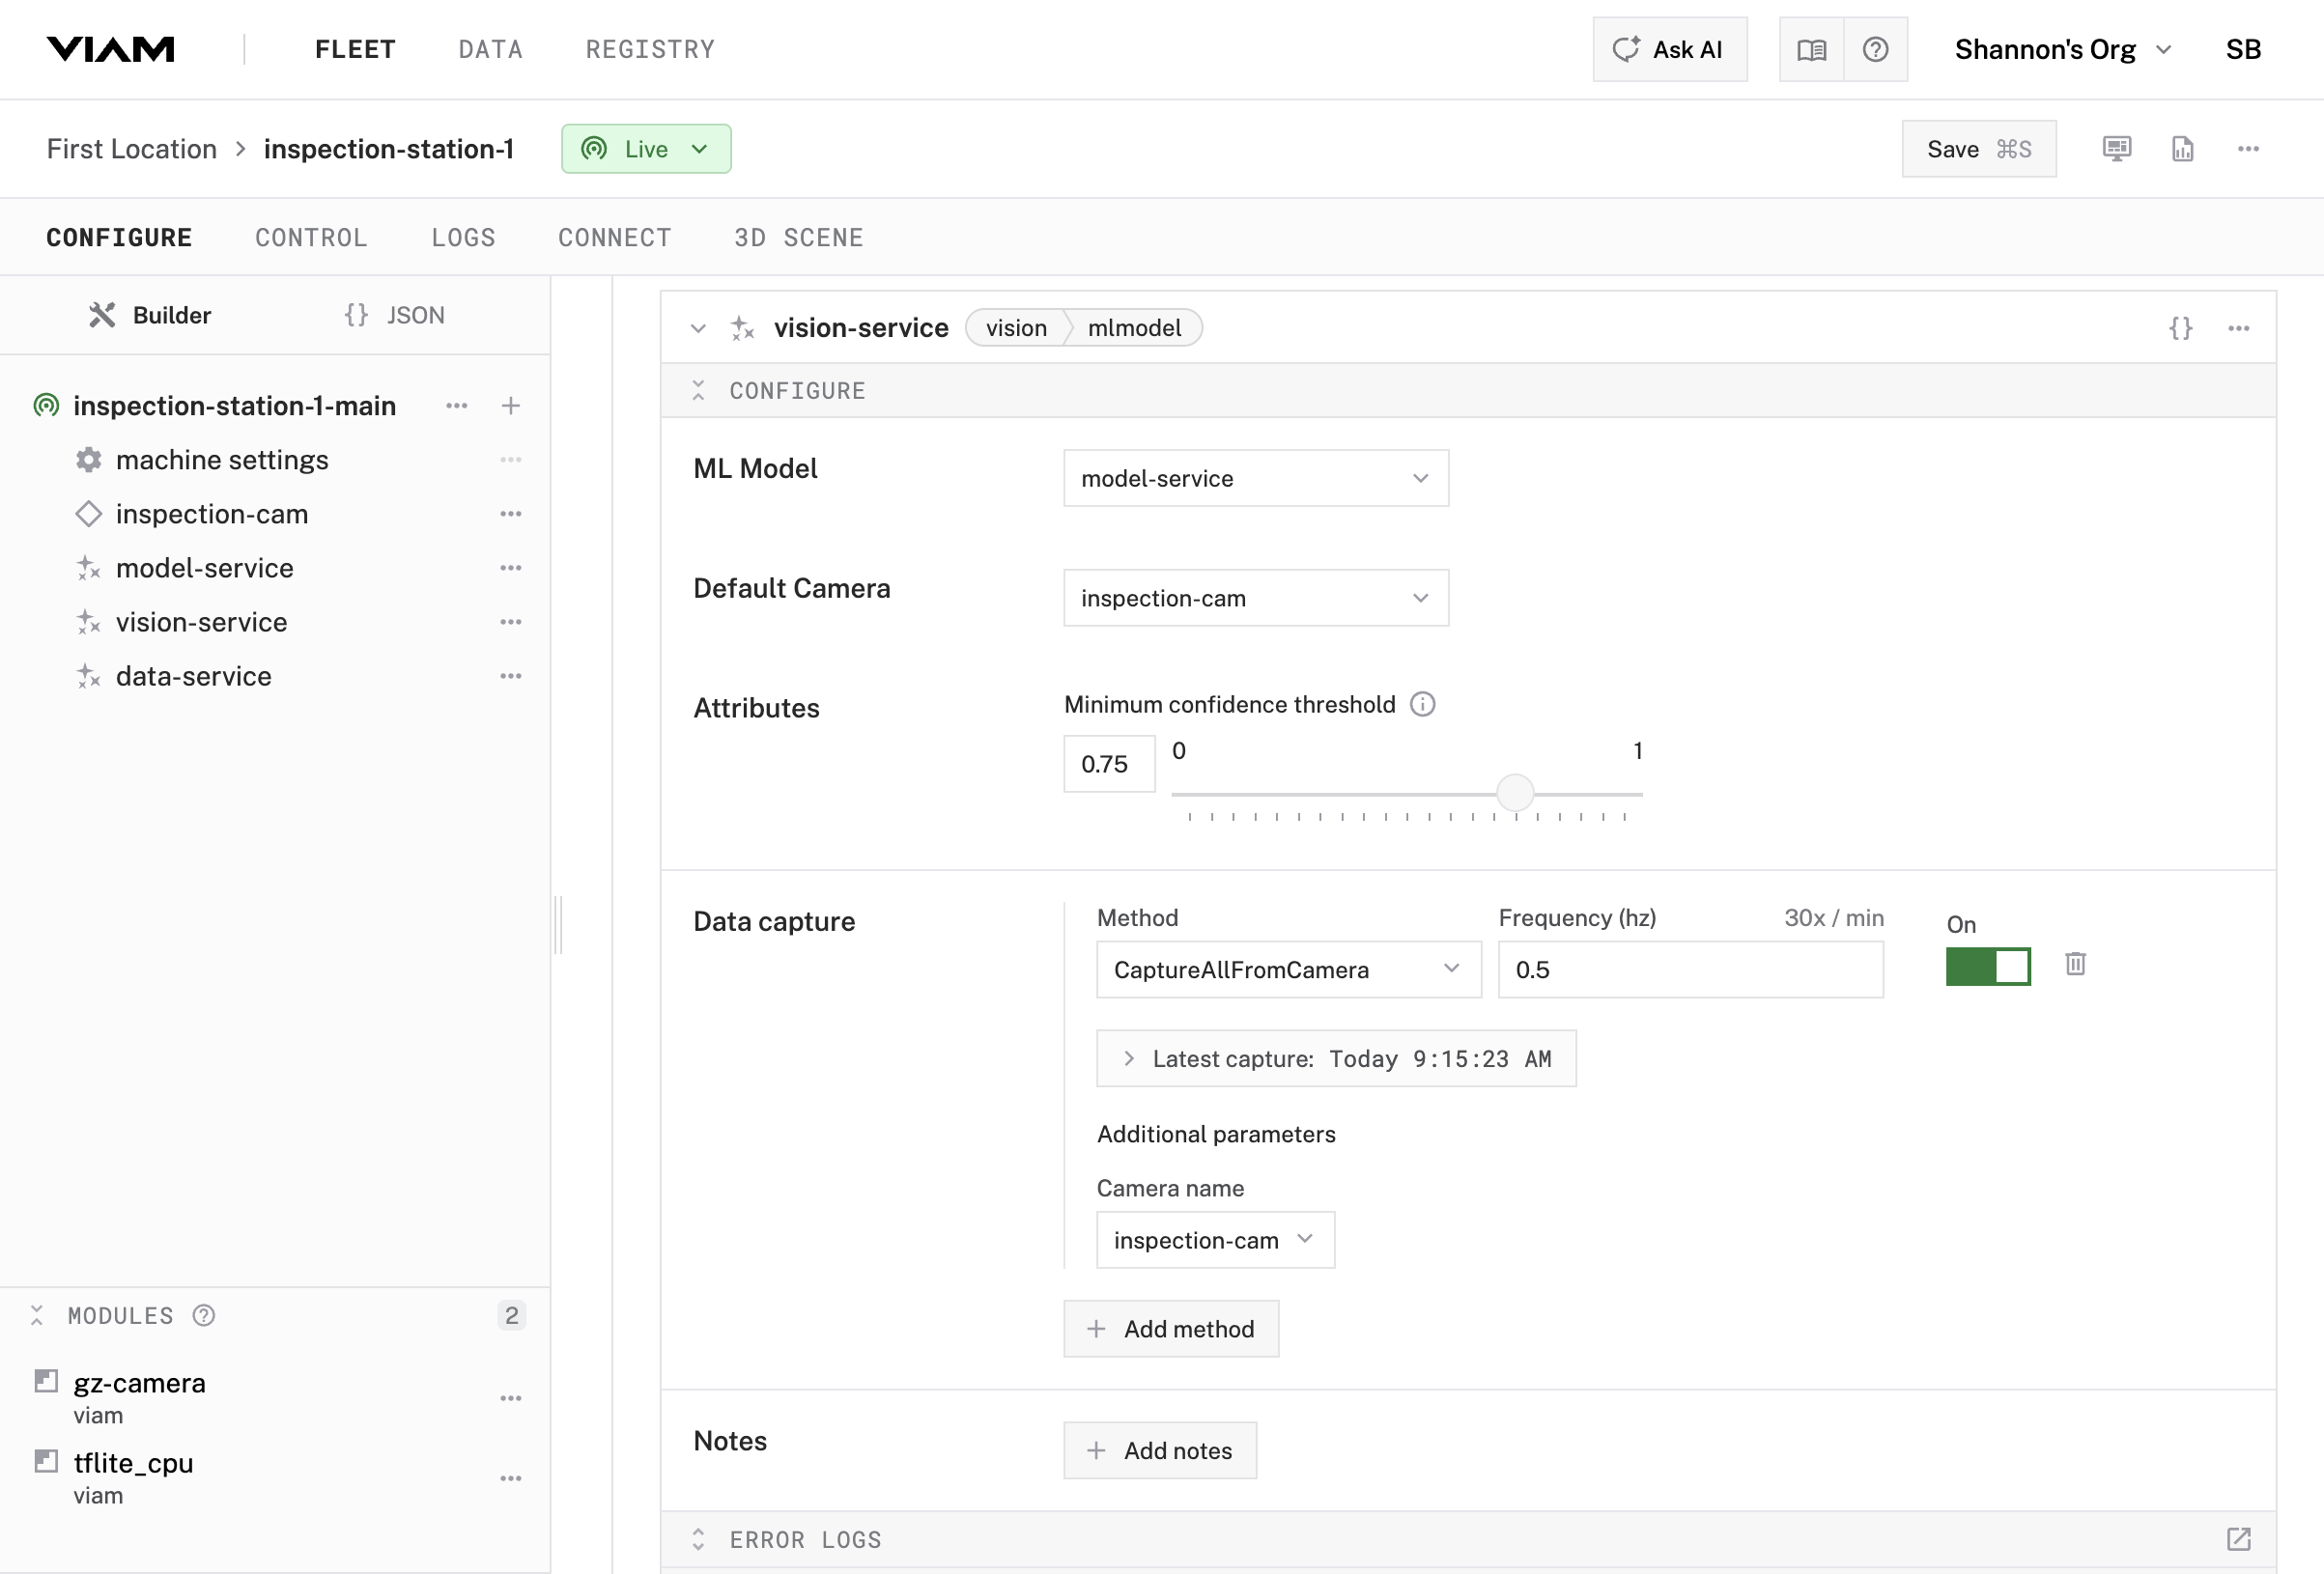
vision-service in your machine configurationCaptureAllFromCamera0.5 (every 2 seconds)inspection-camVerify it’s working:
vision-service configuration panel you should now see a collapsible component labeled Latest capture with a day and time specifiedYour machine is now capturing detection results and images every 2 seconds and syncing them to the Viam cloud application. Once synced to the cloud, the data is removed from your machine to free up storage.

Click JSON in the Configure tab to see how data capture settings appear in the raw configuration.
Each component and service with data capture enabled has a service_configs entry containing capture_methods.
Up to this point in the tutorial, you’ve focused on configuring your machine. To view the data you are now capturing, you will need to open the data user interface in Viam. Find the main Viam menu that includes: Fleet, Data, and Registry at the top of the page. Right click on Data to open in a separate tab.
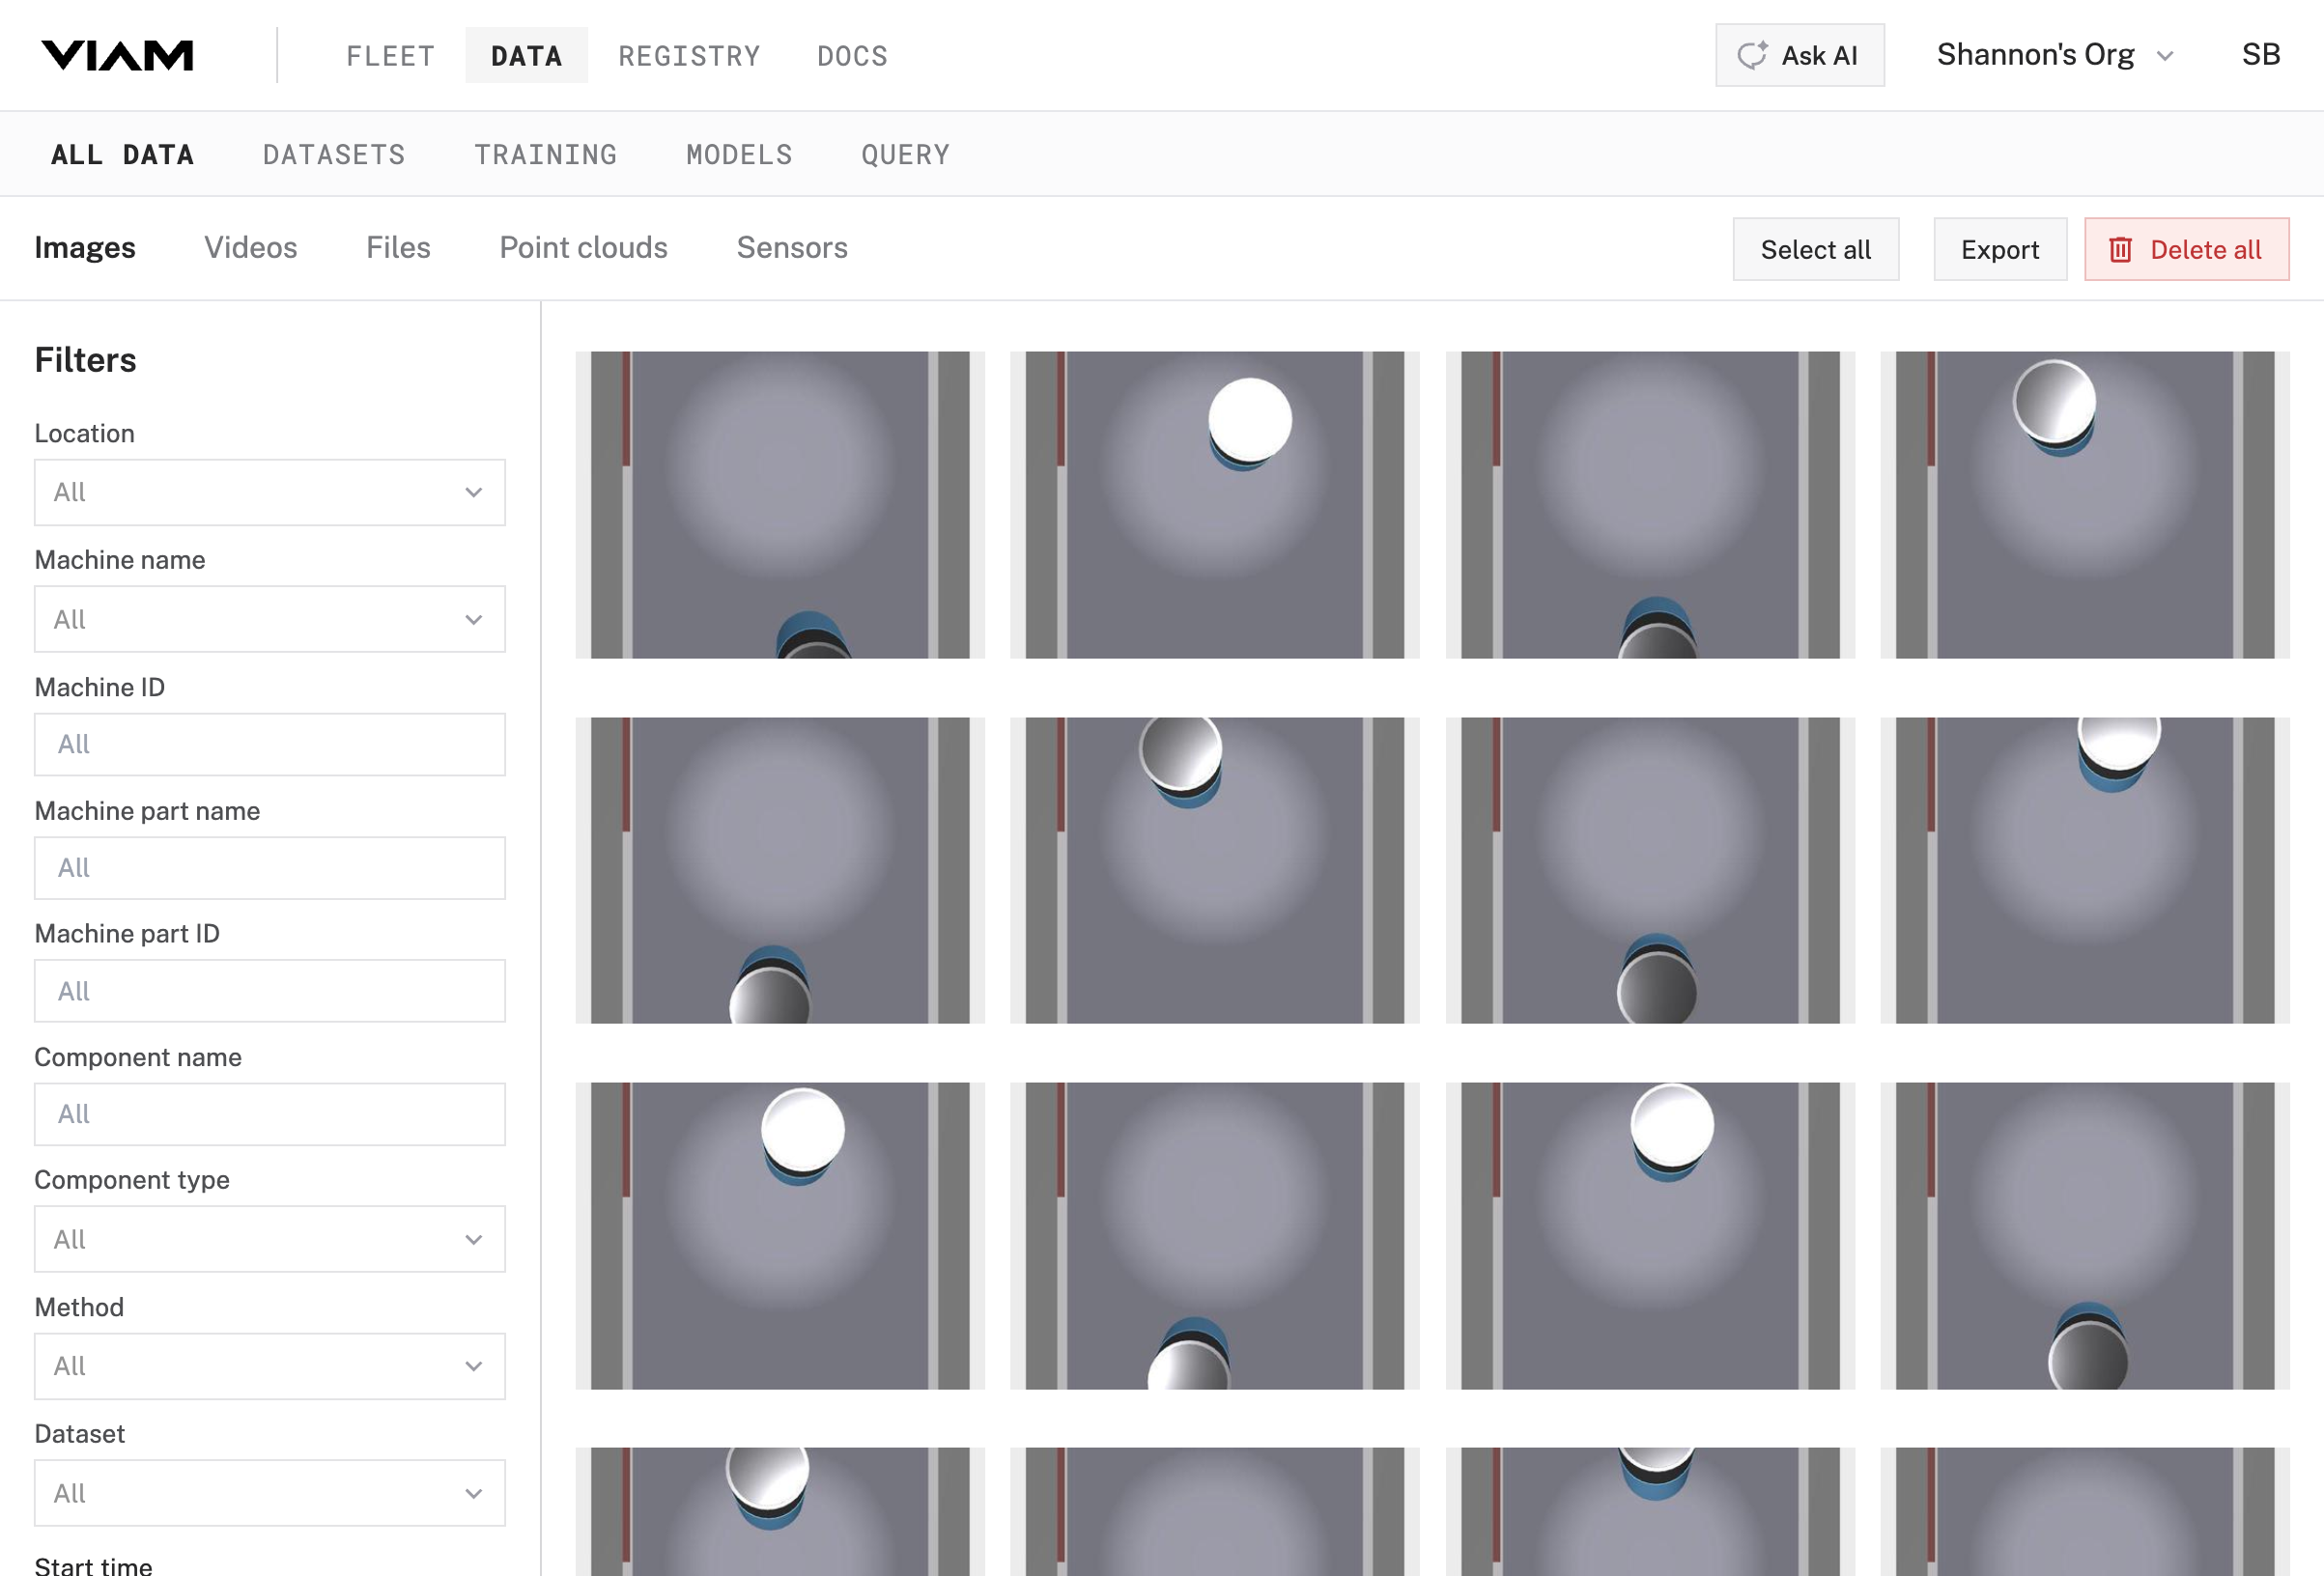
View captured data:
Review the grid of images captured from your work cell
Click on an image to see the detection results for that image
Click on a few other images to see how detection results vary for cans labeled PASS versus FAIL

This captured data serves multiple purposes:
Data capture is now running in the background:
This foundation records everything your vision pipeline sees. In Part 3, you’ll write custom control logic to act on detections. Later, you’ll configure tabular data capture to enable SQL queries on detection results.
Your system captures every detection as an image. Data syncs to the cloud where you can browse, filter, and review results.
Continue to Part 3: Control Logic →
Was this page helpful?
Glad to hear it! If you have any other feedback please let us know:
We're sorry about that. To help us improve, please tell us what we can do better:
Thank you!