Previous
Part 4: Deploy a Module
Goal: Build a dashboard to monitor your inspection system.
Skills: Creating Teleop workspaces, configuring dashboard widgets, writing MQL aggregation pipelines.
Time: ~10 min
You’ve built a working inspection system—but monitoring it requires navigating through the Viam app’s configuration and data tabs. In this section, you’ll create a dedicated dashboard that shows everything at a glance: live camera feeds and defect trends over time.
Viam’s Teleop interface lets you create custom monitoring dashboards. You’ll add widgets for camera streams and time series graphs that use MQL aggregation pipelines to analyze your detection data.
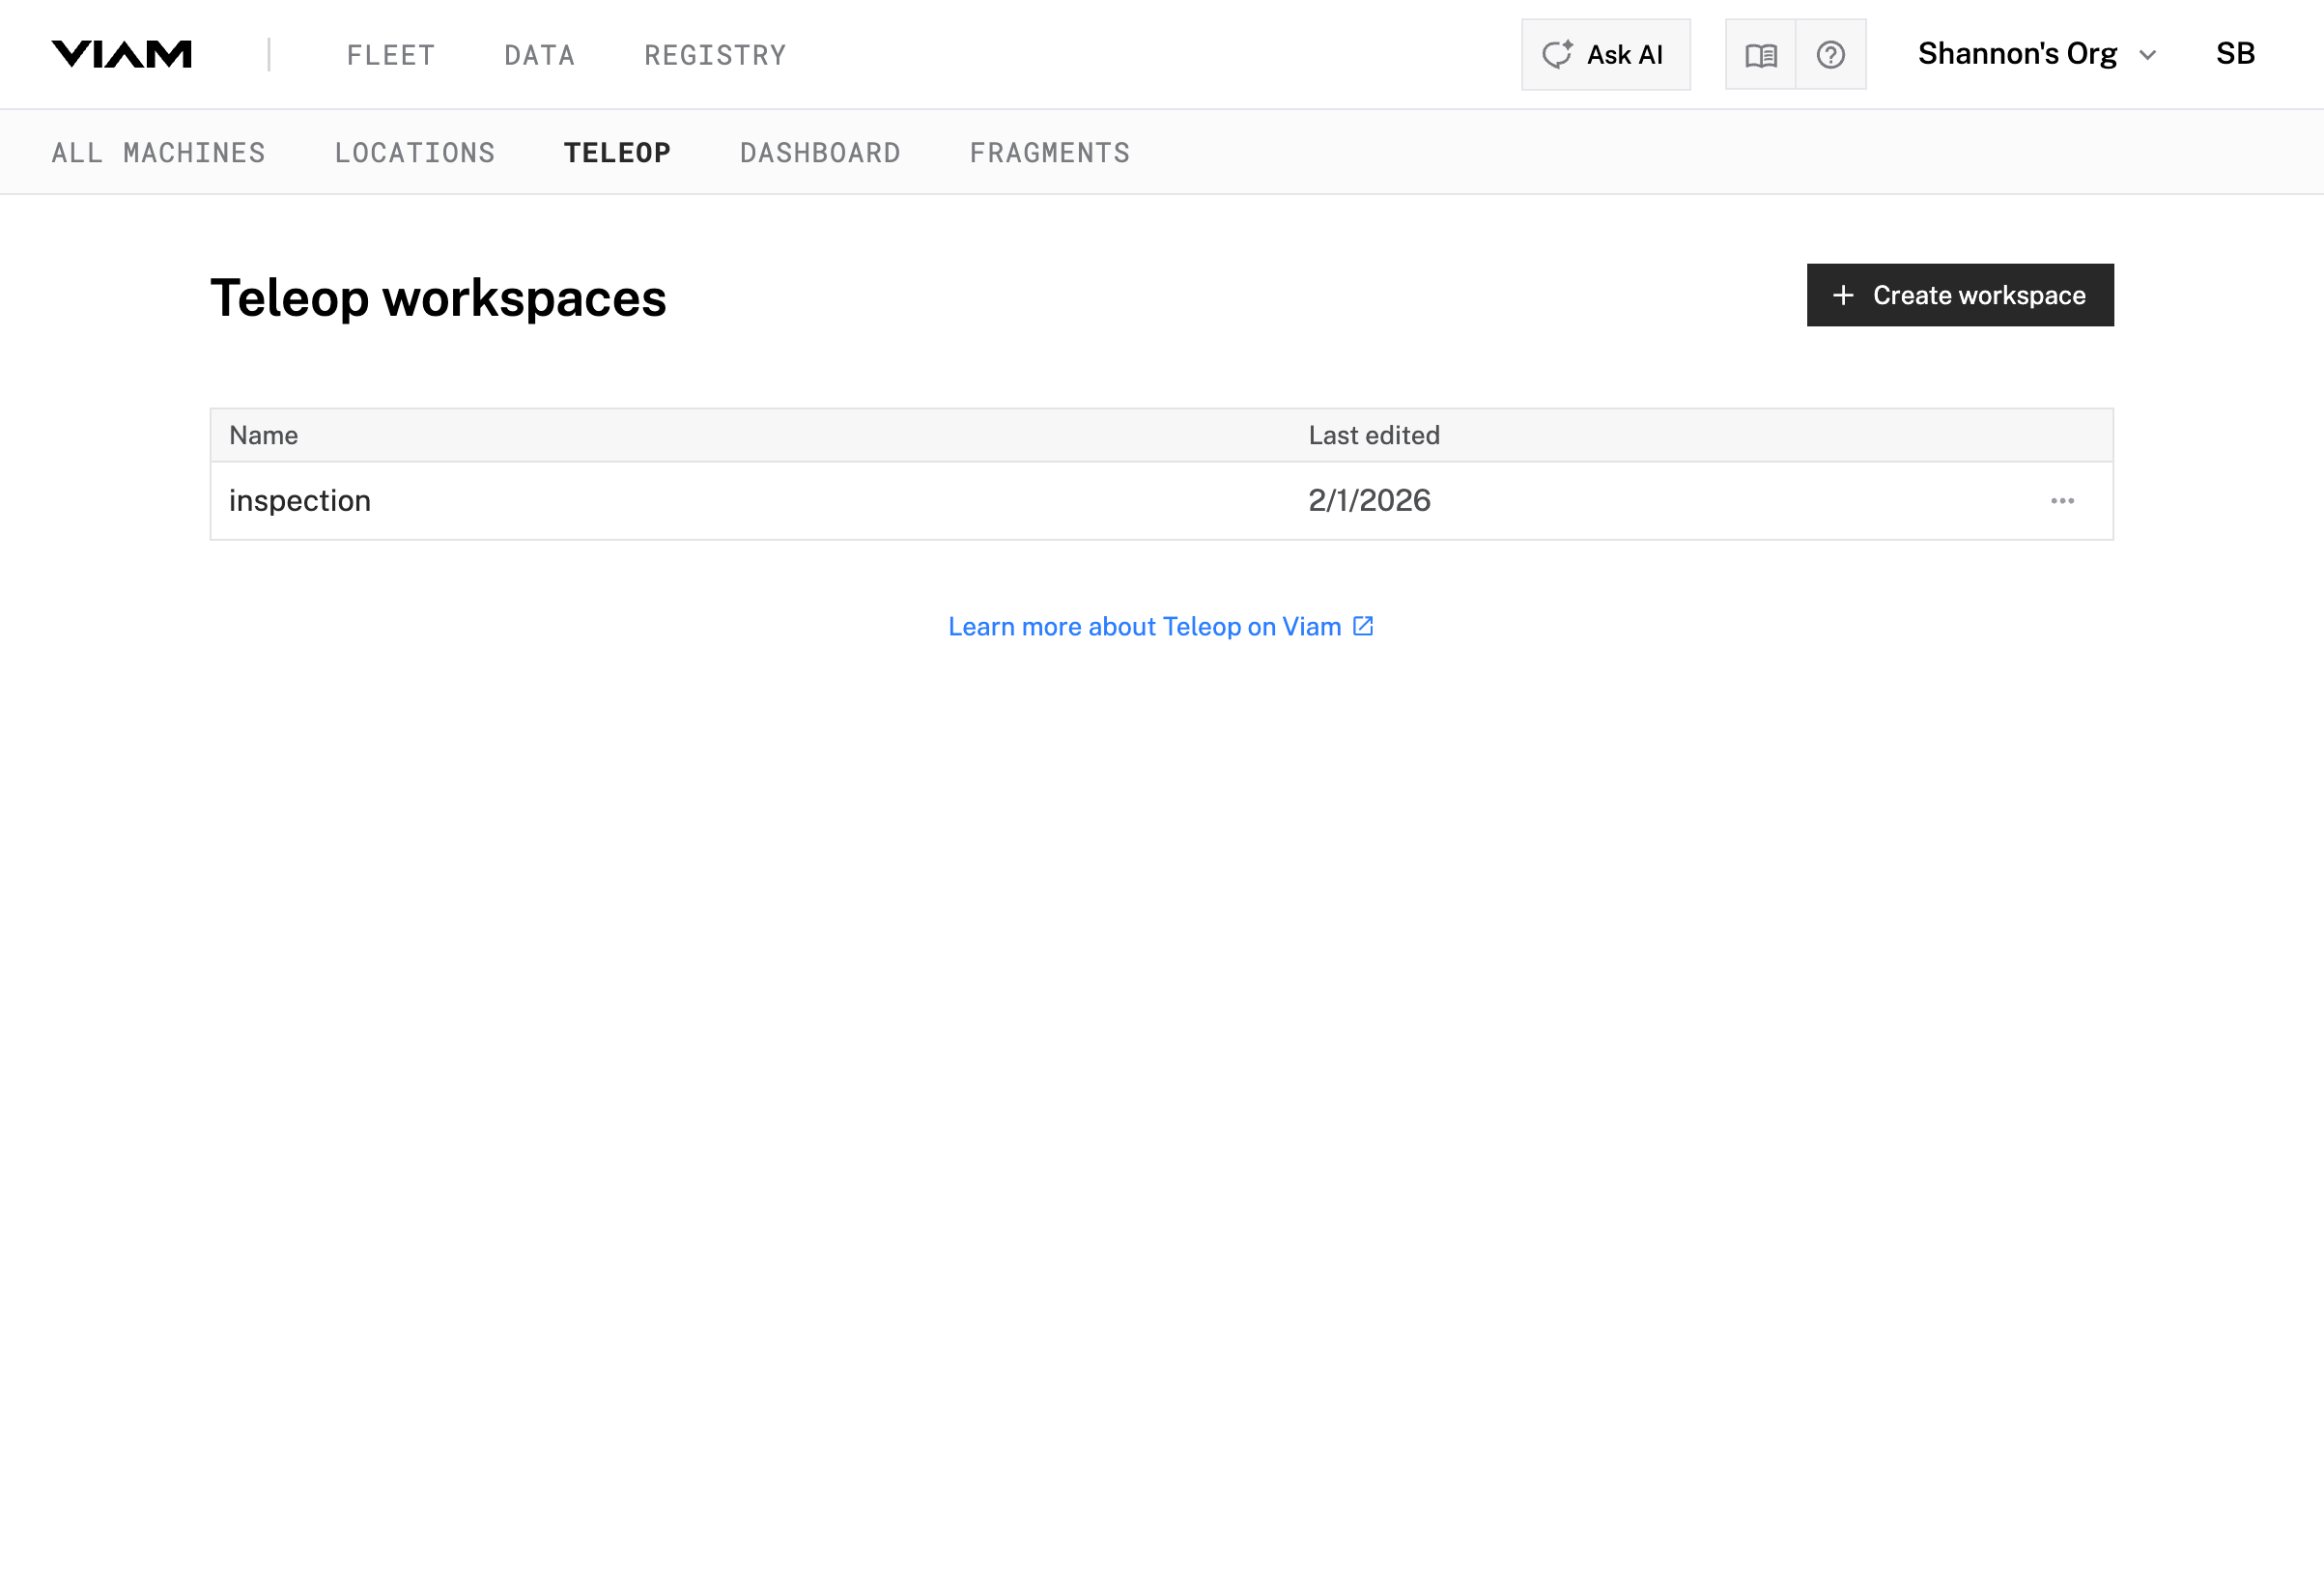
A workspace is a custom dashboard view for your machines.
inspectionHome (or your location name)inspection-station-1
You now have an empty workspace ready for widgets.
Add a live video feed from your inspection camera.
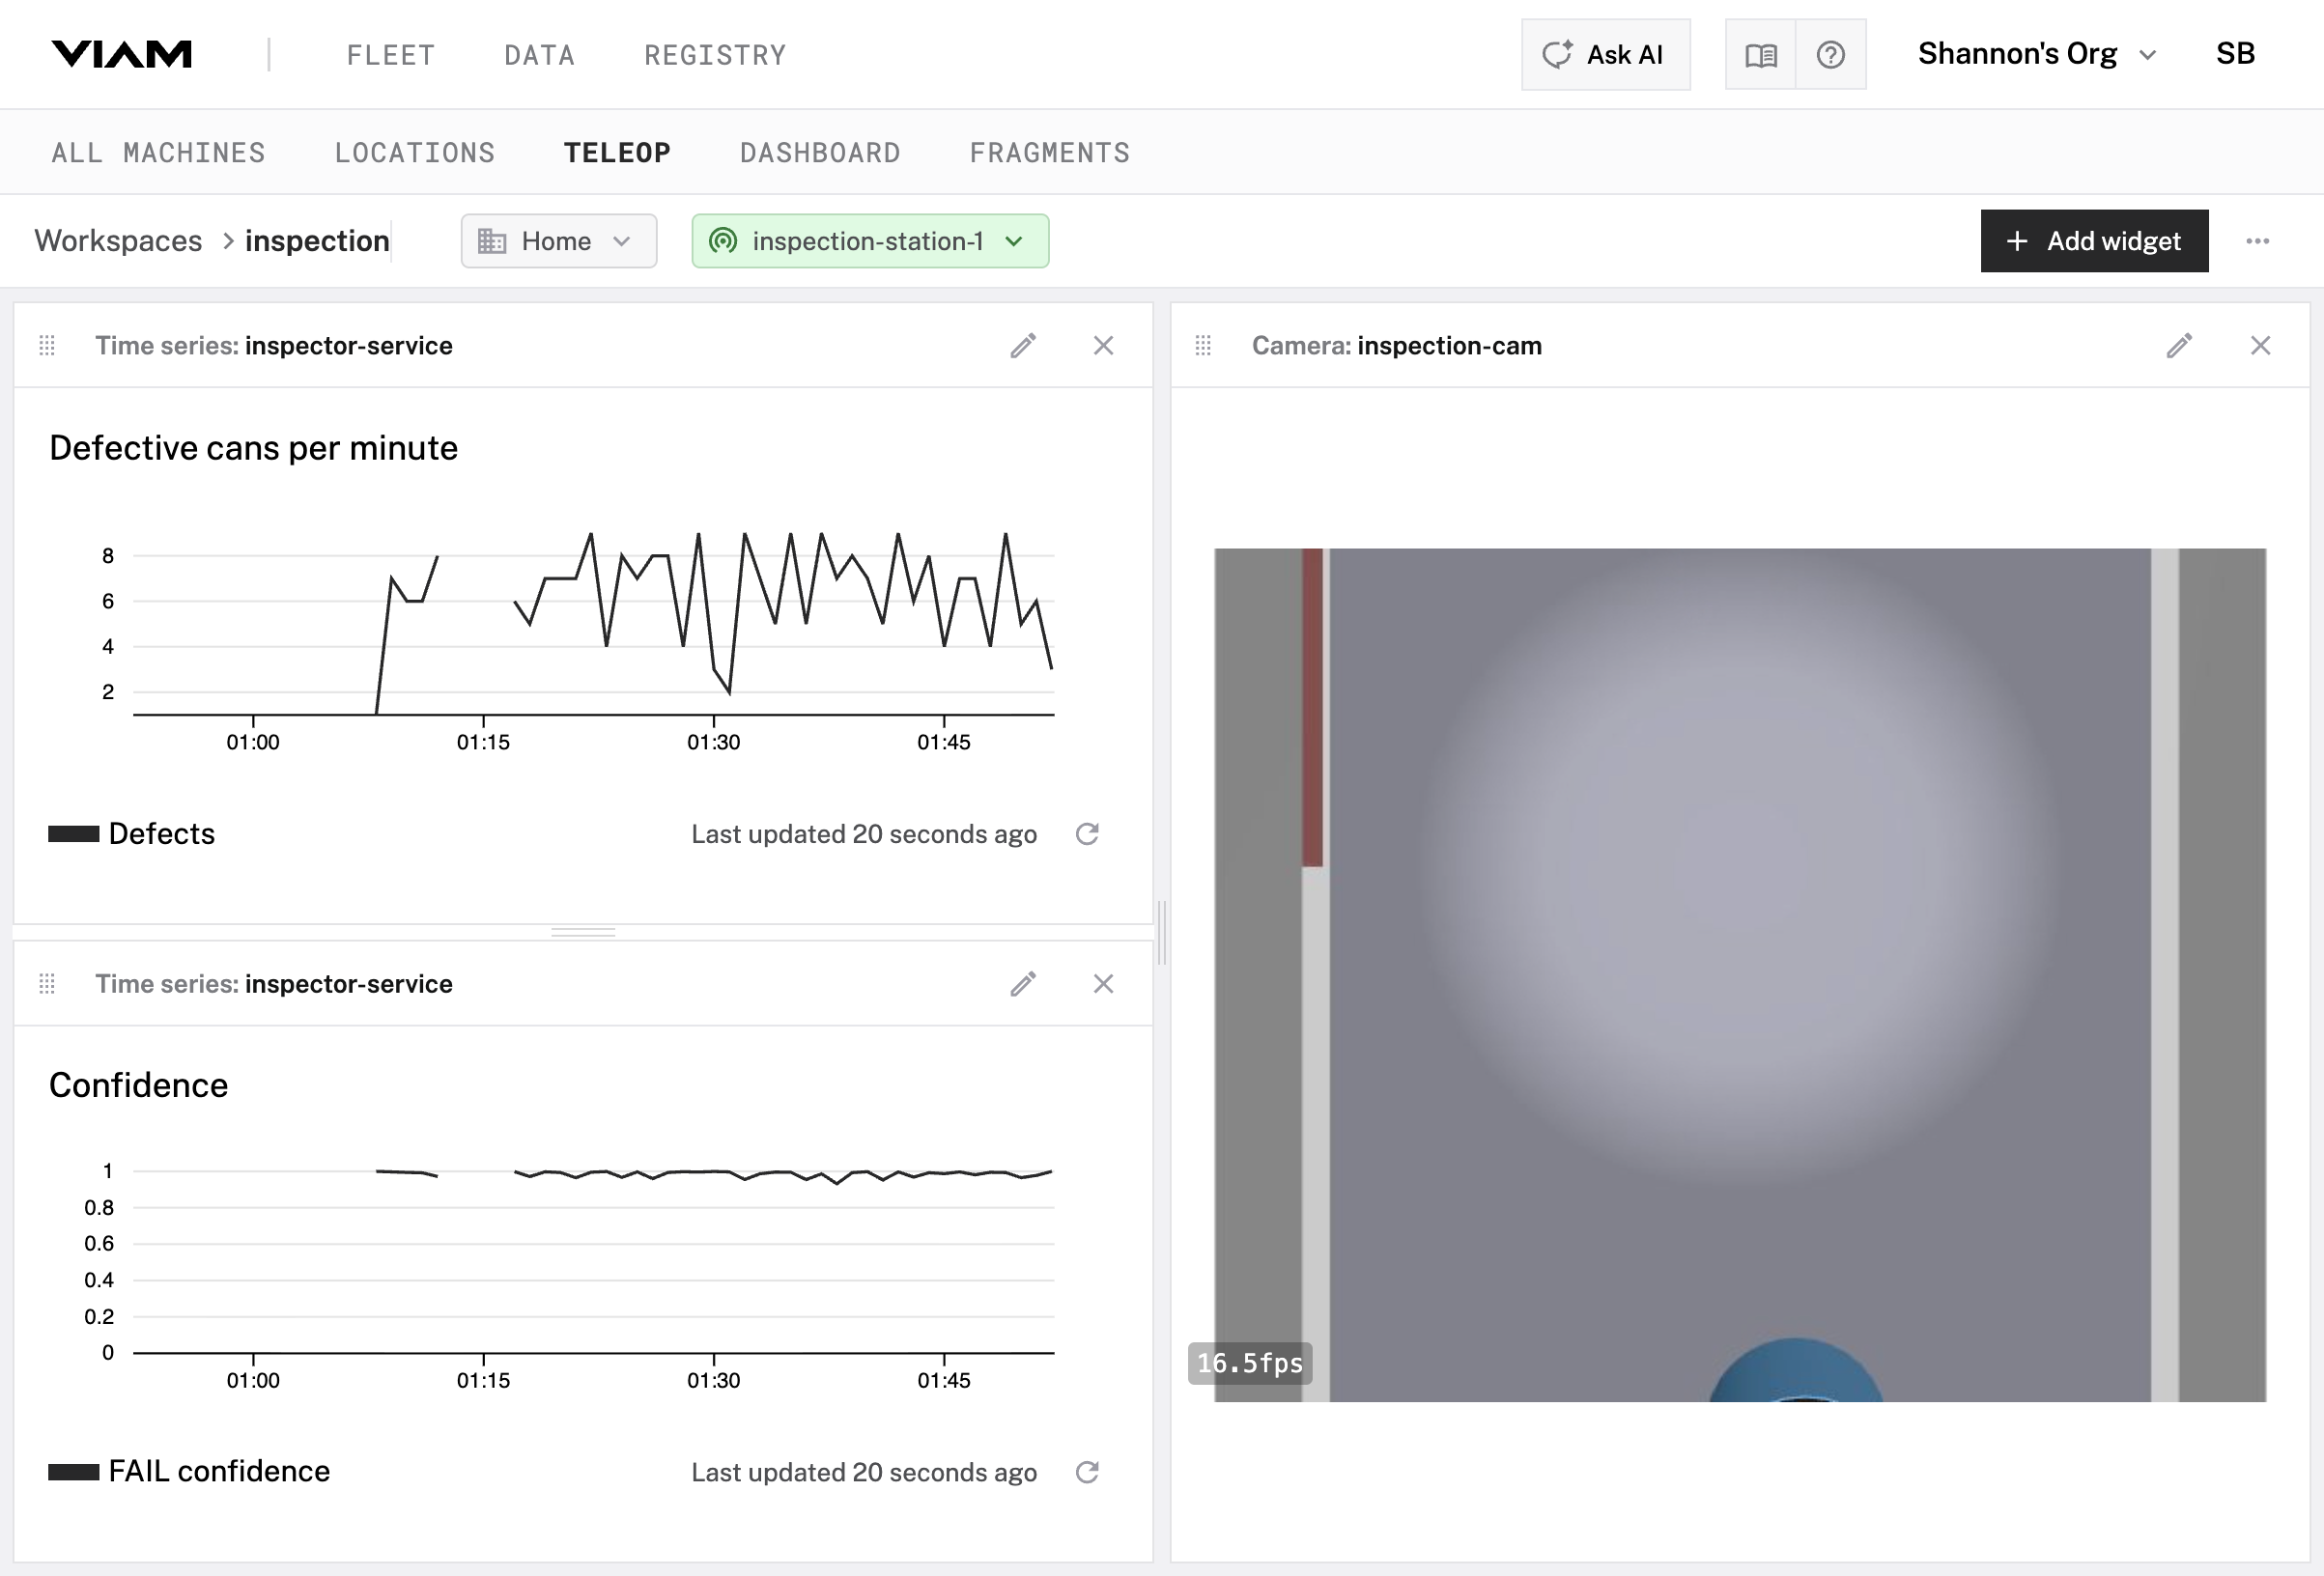
inspection-camLiveYou should see the live feed from your inspection camera with cans passing on the conveyor belt.
Now you’ll create a time series graph showing how many defective cans are detected per minute. This requires a custom MQL aggregation pipeline to filter for failures and count them in time buckets.
Recall the data structure from Part 4—each detection looks like:
{
  "component_name": "inspector-service",
  "time_received": "2026-02-02T02:23:27.326Z",
  "data": {
    "docommand_output": {
      "label": "FAIL",
      "confidence": 0.965815
    }
  }
}
You’ll write MQL stages that filter for FAIL labels and count them per minute.
Create the widget:
Defective cans per minute6060autoConfigure the line:
inspector-serviceDoCommandDefectsAdd the MQL stages:
The custom query method lets you write MongoDB aggregation pipeline stages. You need three stages: match, group, and project.
In Custom MQL Stages, add a $match stage to filter for failures only:
{
  "$match": {
    "data.docommand_output.label": "FAIL"
  }
}
Click + Add stage and add a $group stage to count failures per 60-second bucket:
{
  "$group": {
    "_id": {
      "$dateTrunc": {
        "date": "$time_received",
        "unit": "second",
        "binSize": 60
      }
    },
    "value": {
      "$sum": 1
    }
  }
}
Click + Add stage and add a $project stage to format the output:
{
  "$project": {
    "time": "$_id",
    "value": true
  }
}
Click Save
The graph now shows the count of defective cans detected in each minute.
_id to time (required format for the graph)Add another time series showing the average confidence of failure detections over time. This helps you monitor model performance—if confidence drops, you may need to retrain.
Confidence606001Configure the line:
inspector-serviceDoCommandFAIL confidenceAdd the MQL stages:
Add a $match stage:
{
  "$match": {
    "data.docommand_output.label": "FAIL"
  }
}
Click + Add stage and add a $group stage that averages confidence:
{
  "$group": {
    "_id": {
      "$dateTrunc": {
        "date": "$time_received",
        "unit": "second",
        "binSize": 60
      }
    },
    "value": {
      "$avg": {
        "$convert": {
          "input": "$data.docommand_output.confidence",
          "to": "double",
          "onError": "$data.docommand_output.confidence"
        }
      }
    }
  }
}
Click + Add stage and add a $project stage:
{
  "$project": {
    "time": "$_id",
    "value": true
  }
}
Click Save
The graph shows average confidence for failure detections over time.
The $convert operator ensures the confidence value is treated as a number for averaging. The onError fallback handles any edge cases where conversion fails.
Drag widgets to create a useful layout:
Your dashboard now provides a complete view of your inspection system:

You’ve created a monitoring dashboard using MQL aggregation pipelines:
The same MQL pipeline pattern—filter, aggregate, project—can be adapted for other metrics: pass rate, throughput, detection latency, or any data your system captures.
For fully custom dashboards with your own branding, you can build web applications using Viam’s TypeScript SDK. The SDK provides access to the same data through tabularDataByMQL() and tabularDataBySQL() methods.
You’ve completed the tutorial. Here’s what you built:
You’ve gone from an empty machine to a production-ready inspection system with monitoring—patterns that apply to any Viam application.
← Back to Overview to review what you learned.
Was this page helpful?
Glad to hear it! If you have any other feedback please let us know:
We're sorry about that. To help us improve, please tell us what we can do better:
Thank you!