Monitor Air Quality with a Fleet of Sensors
This tutorial walks you through how to set up a fleet of air quality monitoring machines as though you were creating a company selling air quality machines. You will learn how to set up a fleet of devices for yourself or third parties to collect air quality data. You will then create a web application that shows the most recent reading for any device a user has access to.
Learning Goals
By completing this project, you will learn to:
- Configure a fleet of machines using fragments
- Organize your fleet using locations
- Collect and sync data from multiple machines
- Use the Viam TypeScript SDK to query sensor data
- Create a custom dashboard that you and third parties can use to view data for machines
Requirements
You can create one or more machines to measure air quality. For each machine, you need the following hardware:
- A SDS011 Nova PM sensor
- If you choose to use a different air quality sensor, you may need to create your own module implementing the sensor API for your specific hardware.
- A single-board computer (SBC) capable of running
viam-server - An appropriate power supply
Set up one device for development
In this section we’ll set up one air quality machine as our development device. Later in this tutorial, you will learn to provision multiple devices using fragments.
Create your machine
Navigate to Viam in a web browser. Create an account and log in.
Click the dropdown in the upper-right corner of the FLEET page and use the + button to create a new organization.
This tutorial walks you through how to set up your fleet as though you were creating a company selling air quality machines. The organization represents this company. If you already have a different suitable organization, you can use that instead. Name the organization and click Create.
Click FLEET in the upper-left corner of the page and click LOCATIONS.
A new location called First Location is automatically generated for you.
Use the … menu next to edit the location name to Development, then click Save.
Connect a PM sensor to a USB port on the machine’s SBC. Then connect your device to power.
If the computer does not already have a Viam-compatible operating system installed, follow the prerequisite section of the setup guide to install a compatible operating system.
You do not need to follow the “Install viam-server” section; you will do that in the next step!
Enable serial communication so that the SBC can communicate with the air quality sensor.
For example, if you are using a Raspberry Pi, SSH to it and enable serial communication using sudo raspi-config.
Add a new machine using the button in the top right corner of the LOCATIONS tab.
Follow the Set up your machine part instructions to install viam-server on the machine and connect it to Viam.
When your machine shows as connected, continue to the next step.
Configure your sensor
Navigate to the CONFIGURE tab of the machine, click the + button and select Configuration block.
Click sensor, then search for sds011 and add the sds001:v1 module.
Name the sensor PM_sensor and click Create.

In the newly created PM_sensor card, replace the contents of the attributes box (the empty curly braces {}) with the following:
{
  "usb_interface": "<REPLACE WITH THE PATH YOU IDENTIFY>"
}
To figure out which port your sensor is connected to on your board, SSH to your board and run the following command:
ls /dev/serial/by-id
This should output a list of one or more USB devices attached to your board, for example usb-1a86_USB_Serial-if00-port0.
If the air quality sensor is the only device plugged into your board, you can be confident that the only device listed is the correct one.
If you have multiple devices plugged into different USB ports, you may need to choose one path and test it, or unplug something, to figure out which path to use.
Now that you have found the identifier, put the full path to the device into your config, for example:
{
  "usb_interface": "/dev/serial/by-id/usb-1a86_USB_Serial-if00-port0"
}
Save the config.

On your sensor configuration panel, click on the TEST panel to check that you are getting readings from your sensor.

If you do not see readings, check the LOGS tab for errors, double-check that serial communication is enabled on the single board computer, and check that the usb_interface path is correctly specified.
Configure data management
You have configured the sensor so the board can communicate with it, but sensor data is not yet being saved anywhere. Viam’s data management service lets you capture data locally from each sensor and then sync it to the cloud where you can access historical sensor data and see trends over time. As you configure more sensing machines, you’ll be able to remotely access data from all machines.
Click + and add the data management service.
On the data manager panel:
- Toggle Syncing to the on position.
- Set the sync interval to
0.05minutes (every 3 seconds). - In the Tags field, add
air-quality. This tag will now automatically be applied to all data collected by this data manager which will make querying data easier.
On the PM_sensor panel, click Add method to add data capture.
- Type: Readings.
- Frequency:
0.1(every 10 seconds).
Save the config.
You can check that your sensor data is being synced by clicking on the … menu and clicking View captured data.
Congratulations. If you made it this far, you now have a functional air quality machine. Let’s create a dashboard for its measurements next.
Create a dashboard
The Viam TypeScript SDK allows you to build custom web interfaces to interact with your machines. For this project, you’ll use it to build a page that displays air quality sensor data for a given location. You’ll host the website with Viam as a Viam application.
The full code is available for reference on GitHub.
Set up your TypeScript project
Complete the following steps on your laptop or desktop.
You don’t need to install or edit anything else on your machine’s single-board computer (aside from viam-server which you already did); you’ll be developing your TypeScript app from your personal computer and hosting it with Viam.
Make sure you have the latest version of Node.JS installed on your computer.
Create a directory on your laptop or desktop for your project.
Name it
Create a file in your
{
  "name": "air-quality-dashboard",
  "description": "A dashboard for visualizing data from air quality sensors.",
  "scripts": {
    "start": "esbuild ./main.ts --bundle --outfile=static/main.js --servedir=static --format=esm",
    "build": "esbuild ./main.ts --bundle --outfile=static/main.js --format=esm"
  },
  "author": "<YOUR NAME>",
  "license": "ISC",
  "devDependencies": {
    "esbuild": "*"
  },
  "dependencies": {
    "@viamrobotics/sdk": "^0.42.0",
    "bson": "^6.6.0",
    "js-cookie": "^3.0.5"
  }
}
Fun fact
The --format=esm flag in the "start" script is important because the ECMAScript module format is necessary to support the BSON dependency this project uses for data query formatting.
If you don’t know what the proceeding sentence means, don’t worry about it; just copy-paste the JSON above and it’ll work.
Install the project’s dependencies by running the following command in your terminal:
npm install
Access machines from your application
Viam applications provide access to a machine by placing its API key into your local storage. You can access the data from your browser’s local storage with the following code.
Create another file inside the
// Air quality dashboard

import * as VIAM from "@viamrobotics/sdk";
import { BSON } from "bson";
import Cookies from "js-cookie";

let access_token = "";
let fragmentID = ""; // Fill in later in the tutorial
let location_id = ""; // Fill in if you have access to many machines

async function main() {
  const opts: VIAM.ViamClientOptions = {
    serviceHost: "https://app.viam.com",
    credentials: {
      type: "access-token",
      payload: access_token,
    },
  };

  // <Insert data client and query code here in later steps>
}

document.addEventListener("DOMContentLoaded", async () => {
  const userTokenRawCookie = Cookies.get("userToken")!;
  const startIndex = userTokenRawCookie.indexOf("{");
  const endIndex = userTokenRawCookie.indexOf("}");
  const userTokenValue = userTokenRawCookie.slice(startIndex, endIndex + 1);
  access_token = JSON.parse(userTokenValue).access_token;

  main().catch((error) => {
    console.error("encountered an error:", error);
  });
});
Local development
For developing your application on localhost:
Run the following command to serve the application you are building:
npm start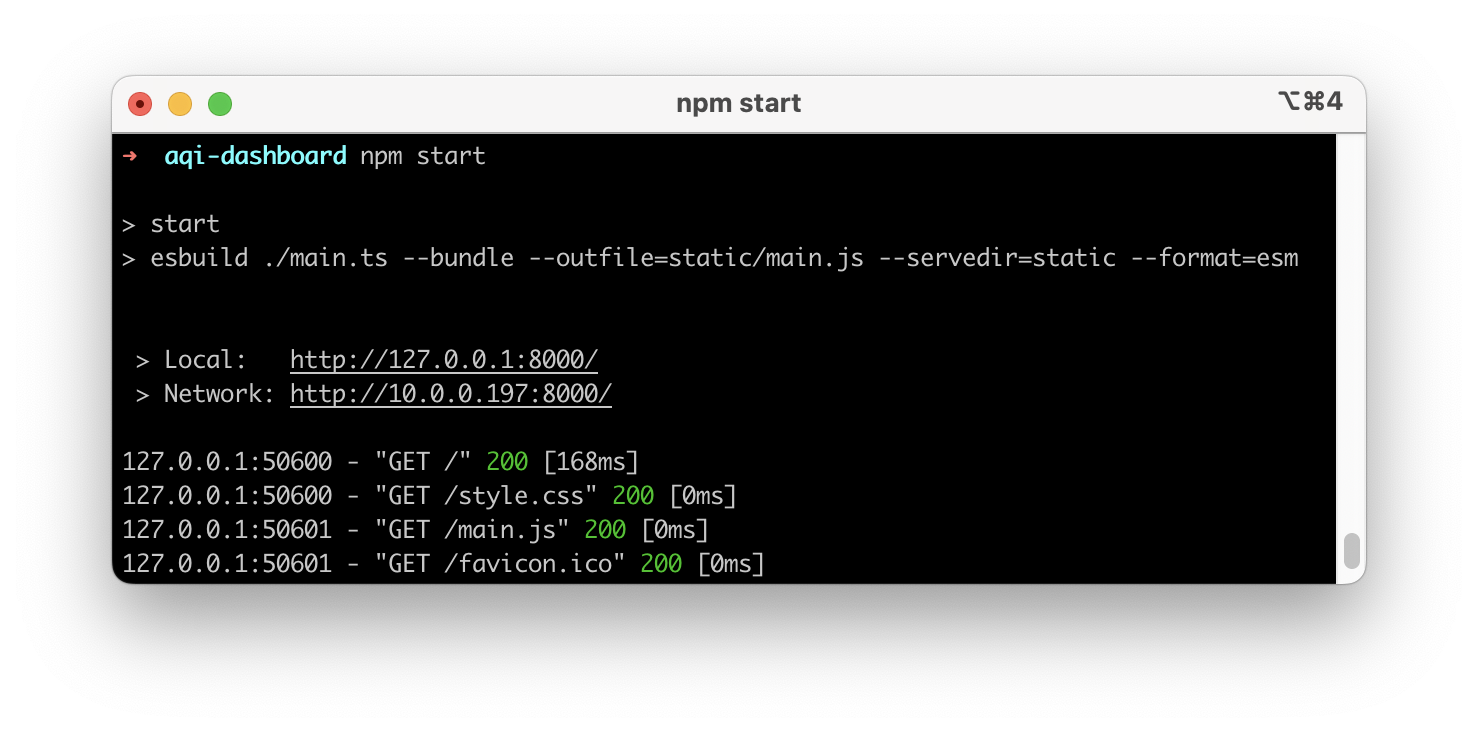
Run the following command specifying the address where your app is running on localhost and a machine to test on. The command will proxy your local app and open a browser window and navigate to
http://localhost:8012/.viam login viam module local-app-testing --app-url http://localhost:8000

Add functionality to your code
Now that you have the connection code, you are ready to add code that establishes a connection from the computer running the code to the Viam Cloud where the air quality sensor data is stored.
You’ll first create a client to obtain all the machines that a user has access to.
Then you’ll get a dataClient instance which can access the machine data.
The code iterates over the machines and queries the average readings for data from the last hour for each machine.
It also filters the data to only query data that is tagged with the air-quality tag you applied with your data service configuration.
Paste the following code into the main function of your locationID line, in place of // <Insert data client and query code here in later steps>:
// Instantiate data_client and get all
// data tagged with "air-quality" from your location
const client = await VIAM.createViamClient(opts);
const dataClient = client.dataClient;
let locationSummaries: any[] = [];
if (fragmentID !== "") {
  locationSummaries = await client.appClient.listMachineSummaries("", [
    fragmentID,
  ]);
} else if (location_id !== "") {
  locationSummaries = await client.appClient.listMachineSummaries(
    "",
    [],
    [location_id],
  );
} else {
  locationSummaries = await client.appClient.listMachineSummaries("");
}

let measurements: any[] = [];
let htmlblock: HTMLElement = document.createElement("div");
let location_orgID_mapping: any[] = [];

// Get all the machine IDs from accessible machines
for (let locationSummary of locationSummaries) {
  console.log(locationSummary);
  let machines = locationSummary.machineSummaries;
  for (let machine of machines) {
    let machineID = machine.machineId;
    let machineName = machine.machineName;
    let orgID = "";

    if (location_orgID_mapping.includes(locationSummary.locationId)) {
      orgID = location_orgID_mapping[locationSummary.locationId];
    } else {
      // Get the full location details to access organizationId
      let locationDetails = await client.appClient.getLocation(
        locationSummary.locationId,
      );
      orgID = locationDetails?.organizations[0].organizationId || "";

      location_orgID_mapping[locationSummary.locationId] = orgID;
    }

    console.log({ machineID, machineName, orgID });

    const match_query = {
      $match: {
        tags: "air-quality",
        robot_id: machineID,
        component_name: "PM_sensor",
        time_requested: { $gte: new Date(Date.now() - 1 * 60 * 60 * 1000) }, // Last 1 hours
      },
    };
    const group_stage = {
      $group: {
        _id: null,
        avg_pm_10: { $avg: "$data.readings.pm_10" },
        avg_pm_2_5: { $avg: "$data.readings.pm_2.5" },
        avg_pm_2_5_alt: { $avg: "$data.readings.pm_2_5" },
      },
    };

    // Get the air quality data for the current machine
    const BSONQueryForData = [
      BSON.serialize(match_query),
      BSON.serialize(group_stage),
    ];
    try {
      let machineMeasurements: any = await dataClient?.tabularDataByMQL(
        orgID,
        BSONQueryForData,
      );
      measurements[machineID] = machineMeasurements;
    } catch (error) {
      console.error(`Error getting data for machine ${machineID}:`, error);
    }

    // <Insert HTML block code here in later steps>
  }
}

return;
The final piece you need to add to this script is a way to create some HTML to display data from each machine in your dashboard.
Paste the following code into the main function of // <Insert HTML block code here in later steps>:
let insideDiv: HTMLElement = document.createElement("div");
if (!measurements[machineID] || measurements[machineID].length === 0) {
console.log(`No measurements found for machine ${machineID}`);
// Create the HTML output for this machine
insideDiv.className = "inner-div " + "unavailable";
insideDiv.innerHTML = "<p>" + machineName + ": No data";
htmlblock.appendChild(insideDiv);
} else {
let avgPM: number = measurements[machineID][0].avg_pm_2_5_alt;
// Color-code the dashboard based on air quality category
let level: string = "lightgray";
switch (true) {
case avgPM < 12.1: {
level = "good";
break;
}
case avgPM < 35.5: {
level = "moderate";
break;
}
case avgPM < 55.5: {
level = "unhealthy-sensitive";
break;
}
case avgPM < 150.5: {
level = "unhealthy";
break;
}
case avgPM < 250.5: {
level = "very-unhealthy";
break;
}
case avgPM >= 250.5: {
level = "hazardous";
break;
}
}
// Create the HTML output for this machine
insideDiv.className = "inner-div " + level;
insideDiv.innerHTML =
"<p>" +
machineName +
": " +
avgPM.toFixed(2).toString() +
" μg/m<sup>3</sup></p>";
htmlblock.appendChild(insideDiv);
}
// Add the block of HTML with color-coded boxes for each machine
document.getElementById("insert-readings")?.replaceWith(htmlblock);
Style your dashboard
You have completed the main TypeScript file that gathers and sorts the data. Now, you’ll create a page to display the data.
Tip
The complete code is available on GitHub as a reference.
Create a folder called
<!doctype html>
<html>
  <head>
    <link rel="stylesheet" href="style.css">
  </head>
  <body>
    <div id="main">
      <div>
        <h1>Air Quality Dashboard</h1>
      </div>
      <script type="module" src="main.js"></script>
      <div>
        <h2>PM 2.5 readings</h2>
        <p>The following are averages of the last one hour of readings from each machine:</p>
      </div>
      <div id="insert-readings">
        <div class="spinner-container">
          <div class="spinner"></div>
          <p><i>Loading data...
            It may take a few moments for the data to load.
            Do not refresh page.</i></p>
        </div>
      </div>
      <br>
      <div class="key">
        <p class="title">Key:</p>
        <p class="good">Good air quality</p>
        <p class="moderate">Moderate</p>
        <p class="unhealthy-sensitive">Unhealthy for sensitive groups</p>
        <p class="unhealthy">Unhealthy</p>
        <p class="very-unhealthy">Very unhealthy</p>
        <p class="hazardous">Hazardous</p>
        <p class="unavailable">No data</p>
      </div>
      <p class="refresh-note">
        After the data has loaded, you can refresh the page for the latest readings.
      </p>
    </div>
  </body>
</html>
Fun fact
Line 11, highlighted above, is where the HTML output of the TypeScript file
TypeScript is a superset of JavaScript with added functionality, and it transpiles to JavaScript, which is why your file is called src="main.js".
If you look at line 5 of ./main.ts builds out to static/main.js.
Now you’ll create a style sheet to specify the fonts, colors, and spacing of your dashboard.
Create a new file inside your
Paste the following into
body {
  font-family: Helvetica;
  margin: 0;
  padding: 0;
  min-height: 100vh;
  display: flex;
  flex-direction: column;
}

div {
  background-color: whitesmoke;
}

h1 {
  color: black;
  margin: 0 0 20px 0;
}

h2 {
  font-family: Helvetica;
  margin: 0 0 15px 0;
}

.inner-div {
  font-family: monospace;
  border: 0.2px solid;
  background-color: lightgray;
  padding: 20px;
  margin-top: 10px;
  width: 100%;
  max-width: none;
  font-size: large;
  box-sizing: border-box;
}

.key {
  max-width: none;
  width: 100%;
  padding: 10px 0px;
  box-sizing: border-box;
  margin-top: auto;
  border-top: 1px solid #ccc;
  display: flex;
  flex-wrap: wrap;
}

.key p {
  padding: 5px;
  font-size: 0.9em;
  max-width: 210px;
  margin: 5px 0px;
}

.key p.title {
  margin-right: 10px;
}

.refresh-note {
  margin: 0.25em;
  font-size: 0.9em;
}

.good {
  background-color: lightgreen;
}

.moderate {
  background-color: yellow;
}

.unhealthy-sensitive {
  background-color: orange;
}

.unhealthy {
  background-color: red;
}

.very-unhealthy {
  background-color: violet;
}

.hazardous {
  color: white;
  background-color: purple;
}

.unavailable {
  background-color: lightgray;
}

#main {
  width: 100%;
  max-width: none;
  min-height: 100vh;
  padding: 20px;
  box-sizing: border-box;
  display: flex;
  flex-direction: column;
}

/* Mobile responsiveness */
@media (max-width: 768px) {
  #main {
    padding: 15px;
  }

  .inner-div {
    padding: 15px;
    font-size: medium;
  }

  h1 {
    font-size: 1.5em;
  }

  h2 {
    font-size: 1.3em;
  }
}

.spinner-container {
  display: flex;
  flex-direction: column;
  align-items: center;
  justify-content: center;
  min-height: 60vh;
  text-align: center;
}

.spinner {
  display: block;
  width: 40px;
  height: 40px;
  border: 3px solid #f3f3f3;
  border-top: 3px solid #3498db;
  border-radius: 50%;
  animation: spin 1s linear infinite;
  margin: 0 auto 20px auto;
}

.spinner-container p {
  margin: 0;
  max-width: 400px;
}

@keyframes spin {
  0% {
    transform: rotate(0deg);
  }
  100% {
    transform: rotate(360deg);
  }
}
Full tutorial code
You can find all the code in the GitHub repo for this tutorial.
Run the code
Run the following command to serve the application you are building:
npm startRun the following command specifying the address where your app is running on localhost. The command will proxy your local app and open a browser window and navigate to
http://localhost:8012.viam login viam module local-app-testing --app-url http://localhost:8000The data may take a few seconds to several minutes to load, because it iterates over all machines you have access to.
Later in the tutorial, you’ll create a fragment for your machines. Once you do that you can update the value for
fragmentIdat the top of the<FILE>main.ts</FILE>file to limit the number of machines your code iterates over. In the meantime you can limit the number of machines that your dashboard iterates over by providing the location ID at the top of themain.ts :let location_id = "";If the dashboard does not appear, right-click the page, select Inspect, and check for errors in the console.
Deploy the application as a Viam application
You’ve learned how to configure a machine and you can view its data in a custom TypeScript dashboard. Let’s deploy this dashboard as a Viam-hosted application so you don’t have to run it locally. This will also allow others to use the dashboard.
Create a
{
  "module_id": "<your-namespace>:air-quality",
  "visibility": "public",
  "url": "https://github.com/viam-labs/air-quality-fleet/",
  "description": "Display air quality data from a machine",
  "applications": [
    {
      "name": "air-quality",
      "type": "multi_machine",
      "entrypoint": "static/index.html"
    }
  ]
}
In Viam, navigate to your organization settings through the menu in upper right corner of the page.
Find the Public namespace and copy that string.
Replace <your-namespace> with your public namespace.
Register your module with Viam:
viam module create --name="air-quality" --public-namespace="your-namespace"
Package your static files and your
npm run build
tar -czvf module.tar.gz static meta.json
viam module upload --upload=module.tar.gz --platform=any --version=0.0.1
For subsequent updates run these commands again with an updated version number.
Try your application by navigating to:
https://air-quality_your-public-namespace.viamapplications.com
Log in and select your development machine. Your dashboard should now load your data.
Organize devices for third-party usage
The following example shows how you can use organizations and locations to provide users access to the right groups of machines.
Imagine you create an air quality monitoring company called Pollution Monitoring Made Simple. Anyone can sign up and order one of your sensing machines. When a new customer signs up, you assemble a new machine with a sensor, SBC, and power supply.
Before shipping the sensor machine to your new client, you provision the machine, so that the recipient only needs to connect the machine to their WiFi network for it to work.
To manage all your company’s air quality sensing machines together, you create one organization called Pollution Monitoring Made Simple. An organization is the highest level grouping, and often contains all the locations (and machines) of an entire company.
Inside that organization, you create a location for each customer. A location can represent either a physical location or some other conceptual grouping. You have some individual customers, for example Antonia, who has one sensor machine in her home and one outside. You have other customers who are businesses, for example RobotsRUs, who have two offices, one in New York and one in Oregon, with multiple sensor machines in each.
Organization and locations allow you to manage permissions:
- When you provision Antonia’s machines, you create them inside a new location called
Antonia's Homeand grant Antonia operator access to the location. This will later allow her to view data from the air sensors at her home. - When you provision the machines for RobotsRUs, you create a location called
RobotsRUsand two sub-locations forNew York OfficeandOregon Office. Then you create the machines in the sub-locations and grant RobotsRUs operator access to theRobotsRUsmachines location.
You, as the organization owner, will be able to manage any necessary configuration changes for all air quality machines in all locations created within the Pollution Monitoring Made Simple organization.

For more information, see Organize your machines and Provision devices.
Organize your fleet
If you want to follow along, create the following locations:
Antonia's HomeRobotsRUs
For RobotsRUs create two sublocations:
- Add a new location called
Oregon Officeusing the same Add location button. - Then, find the New parent location dropdown on the Oregon Office page.
- Select RobotsRUs and click Change.
Repeat to add the New York office: Add a new location called New York Office, then change its parent location to RobotsRUs.

Get machines ready for third parties
Let’s continue with our fictitious company and assume you want to ship air quality machines out to customers from your factory. In other words, you want to provision devices.
Before an air quality machine leaves your factory, this is an overview of the steps you must complete. These steps will be covered in more detail after this overview.
- You create a machine configuration template: a fragment.
- You flash the SD card for the single-board computer with an operating system.
- You install
viam-agentwith thepreinstallscript on the SD card providing the fragment. - You put the SD card into the machine.
Once a customer receives your machine, they will:
- Plug the machine in and turn it on.
viam-agentwill start a WiFi network.- The customer uses a mobile device to connect to the machine’s WiFi hotspot and provides WiFi credentials to connect to an internet-connected WiFi network.
- The machine now connects to the internet and sets itself up based on the specified fragment.
Create the fragment for air quality machines
In this section you will create the fragment: the configuration template that all other machines will use.
Navigate to the FLEET page and go to the FRAGMENTS tab.
Click Create fragment.
Name the fragment
air-quality-configuration.Add the same components that you added to the development machine when you set up one device for development.
As a shortcut, you can use the JSON mode on the machine you already configured and copy the machine’s configuration to the fragment.
If you only have one USB device plugged into each of your boards, the
usb_interfacevalue you configured in the sensor config is likely (conveniently) the same for all of your machines.If not, you can use fragment overwrite to modify the value on any machine for which it is different.
Specify the version for the
sds011module. At the time of writing the version is0.2.1. Specifying a specific version or a specific minor or major version of a module will ensure that even if the module you use changes, your machines remain functional. You can update your fragment at any point, and any machines using it will update to use the new configuration.
Tip: Use the fragment on your development machine
To avoid differences between fragment and development machines, we recommend you remove the configured resources from the development machine, and instead use the + button to add the fragment you just created.
Provision your machines
Create a file called
{
  "network_configuration": {
    "manufacturer": "Pollution Monitoring Made Simple",
    "model": "v1",
    "fragment_id": "<FRAGMENT-ID>",
    "hotspot_prefix": "air-quality",
    "hotspot_password": "WeLoveCleanAir123",
    "disable_bt_provisioning": true
  }
}
Replace <FRAGMENT-ID> with the fragment ID from your fragment.
You will pass the file to the preinstall script later, so you can store it anywhere.
In Organize your fleet you created several locations. Navigate to one of the locations and create a machine. Select the part status dropdown to the right of your machine’s name on the top of the page.
Click the copy icon next to Machine cloud credentials.
Paste the machine cloud credentials into a file on your hard drive called
Tip: Fleet management API
You can create locations and machines programmatically, with the Fleet management API.
For each machine, flash the operating system to the device’s SD card. If you are using the Raspberry Pi Imager, you must customize at least the hostname for the next steps to work.
Still using the computer used for flashing the SD card, eject and reinsert the card to make sure it’s mounted with the newly written operating system.
Run the following commands to download the preinstall script and make the script executable:
wget https://storage.googleapis.com/packages.viam.com/apps/viam-agent/preinstall.sh
chmod 755 preinstall.sh
curl -O https://storage.googleapis.com/packages.viam.com/apps/viam-agent/preinstall.sh
chmod 755 preinstall.sh
Support notice
Please note this script works only under POSIX (macOS and Linux) at the moment.
Run the preinstall script without options and it will attempt to auto-detect a mounted root filesystem (or for Raspberry Pi, bootfs) and also automatically determine the architecture.
sudo ./preinstall.sh
Follow the instructions and provide the
That’s it! Your device is now provisioned and ready for your end user!
Having trouble? See Provisioning for more information and troubleshooting.
Update your web application
You can now use your fragment ID to improve load times of your dashboard:
In the
main.ts add the fragment ID to the variables at the top of the file.Upload a new version of your web app:
npm run build
tar -czvf module.tar.gz static meta.json
viam module upload --upload=module.tar.gz --platform=any --version=0.0.2
Next steps
You can now set up one or more air quality sensors for yourself or others and access them with your dashboard. If you are selling air quality sensing machines, users can use your dashboard to view their data.
If you’re wondering what to do next, why not set up a text or email alert when your air quality passes a certain threshold? For instructions on setting up an email alert, see the Monitor Helmet Usage tutorial as an example. For an example of setting up text alerts, see the Detect a Person and Send a Photo tutorial.

Was this page helpful?
Glad to hear it! If you have any other feedback please let us know:
We're sorry about that. To help us improve, please tell us what we can do better:
Thank you!